Why GEO ROI remains invisible in May 2026
A Head of E-commerce at a 5M USD ARR skincare brand opens their GA4 and sees 32% of traffic in “Direct”. They know sales are up. They do not know that half of that “Direct” comes from ChatGPT, Perplexity, and Google AI Overviews. They therefore cannot justify a GEO budget to their CFO.
This invisibility has a precise technical cause. AI agents omit the referrer in many cases, for user privacy and hybrid rendering reasons. In Loamly’s 446,405-visit analysis, 14,413 identified dark-AI visits had no referrer, versus 6,015 AI visits with a referrer. The no-referrer group therefore represents 70.6% of the identified AI total and standard GA4 classifies it as “Direct”.
Three articles have already covered pieces of this measurement: Why GA4 is lying about your AI traffic covers server-side traffic detection. Share of AI Voice: the 2026 guide covers citation measurement. But neither links upstream coverage (where your brand appears) with downstream conversion (how much it earns) in a single framework. This article fills that gap: 7 KPIs, an attribution method, and a concrete dashboard you can build this quarter.
May 13, 2026 update: GA4 ships a native “AI Assistant” channel
On May 13, 2026, Google pushed a new entry into the GA4 Default Channel Group: AI Assistant. Traffic whose medium exactly matches ai-assistant lands here; Google’s own examples of such sources are ChatGPT, Gemini, Deepseek, Copilot and Grok, and the channel explicitly excludes AI Overviews and AI Mode (which stay in Organic Search). It appears and a campaign of (ai-assistant), with zero custom configuration. This is the first official Google acknowledgment of an AI acquisition channel, on par with Search or Social.
Practical implication for a Head of E-com: open Acquisition → User Acquisition in GA4, filter on the new “AI Assistant” channel, and you have a baseline AI traffic measurement without any custom middleware. But this channel only captures visits passing a recognized referrer. Loamly’s no-referrer measurement shows why server-side attribution is still required. The GA4 channel is a new floor, not a ceiling.
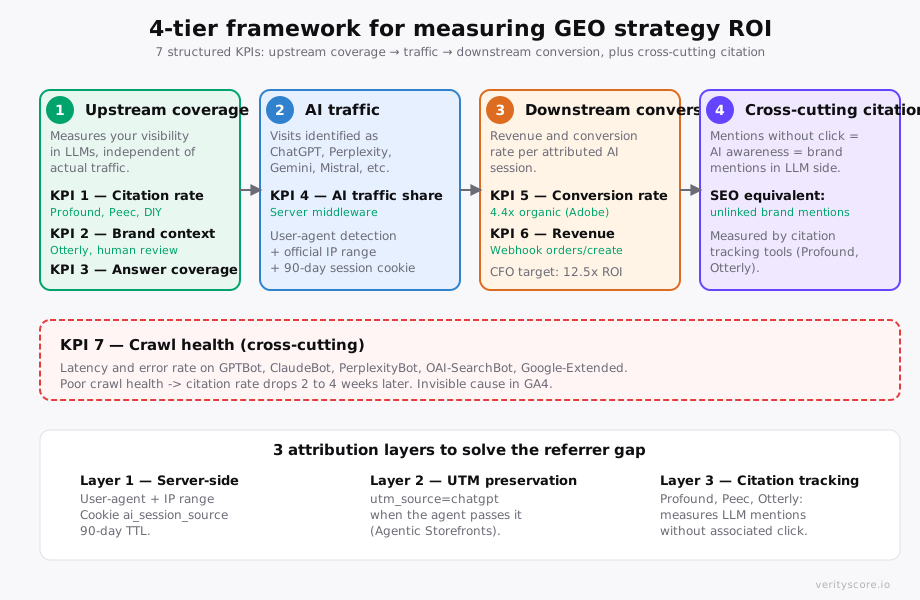
The 4-tier framework: coverage → traffic → conversion → citation
An isolated GEO KPI says nothing. A Share of AI Voice at 12% on a basket of 30 queries has no value if that traffic does not convert. A 6.5% AI conversion rate has no value if your upstream coverage is 0%. You need all four tiers to steer.
Tier 1 : Coverage (upstream): how much and how your brand is cited by LLMs. Independent of actual site traffic.
Tier 2 : Traffic (middle): how many visitors actually come from ChatGPT, Perplexity, Gemini, Mistral Le Chat, Claude, or opaque AI agents.
Tier 3 : Conversion (downstream): what this traffic does on your site (engagement rate, add to cart, conversion rate, average order value).
Tier 4 : Citation without click (cross-cutting): LLM mentions that do not generate clicks but build awareness (the AI equivalent of brand mentions in traditional SEO).
Tier 1 measures visibility, Tier 2 measures audience, Tier 3 measures value, Tier 4 measures awareness. All four reinforce each other: better coverage → more traffic → more conversions → more awareness → better coverage.
The 7 essential KPIs
KPI 1 : Citation rate (Tier 1)
Definition: number of times your brand appears in LLM responses to a basket of 20 to 50 key queries, divided by the total responses generated. Measured per engine (ChatGPT, Perplexity, Gemini, Mistral Le Chat, Claude).
Method: query each engine in private mode with your query basket, count mentions. 2026 tools with verified pricing:
- Profound: Starter at 99 USD/mo billed annually, Growth at 399 USD/mo, and Enterprise on quote. The pricing page offers a free trial for eligible plans.
- Peec AI: Starter at 95 USD/mo, with 50 prompts and a choice of 3 AI models.
- Otterly: from 29 USD/mo (Lite plan). The most affordable, sufficient for ramp-up.
- DIY: weekly spreadsheet with 20 to 30 queries tested in private mode. Zero cost, 2 to 3 hours/week.
Verity Score Q1 2026 benchmark: a 5M USD ARR skincare store with a mature GEO strategy reaches 25 to 40% on Perplexity, 15 to 30% on ChatGPT, 5 to 15% on Gemini. Below 5% on all engines: your brand is invisible in AI mode for your target categories.
KPI 2 : Brand context score (Tier 1)
Definition: quality of the context in which your brand is cited. Three axes: sentiment (positive, neutral, negative), positioning (leader, alternative, niche), direct recommendation (yes, no, conditional).
Method: manual reading of the 20 most recent mentions per engine, scoring on the 3 axes. Emerging tool: Otterly does automated sentiment scoring with 78% precision per their internal audit. Cross-check with human review for strategic decisions.
Why it matters: a brand cited 30 times in a “budget alternative” context does not have the same ROI as a brand cited 15 times as “top recommendation for sensitive skin”.
KPI 3 : Answer coverage (Tier 1)
Definition: % of basket queries where your brand appears at least once. Different from citation rate which counts raw mentions.
Method: on 30 queries, if you appear on 9, your answer coverage is 30%. Track per engine and per query cluster (transactional, informational, comparative).
Benchmark: a mature GEO strategy targets 40 to 60% answer coverage on a targeted transactional basket. Leader stores (Sephora on beauty US, Aroma-Zone on skincare FR) reach 70 to 85%. Below 20%: your coverage is too thin to generate measurable volume.
KPI 4 : AI traffic share (Tier 2)
Definition: % of human visits carrying a measurable AI source signal. Report AI crawler hits separately because bot requests are not user sessions and cannot be combined with human acquisition traffic.
Method: for human visits, capture a recognized referrer, UTM parameter, or click ID in first-party storage and preserve it through checkout. In a separate crawl-health dataset, identify bots from verified user-agent and IP evidence and log their requests. Never infer that a bot crawl and a later buyer are the same session.
Adobe Q2 2026 AI Traffic Report benchmark (March 2026 data, 1 trillion visits across US retailers): AI traffic grew 393% YoY in Q1 2026, reaching 1 to 4% of total visits on average, with peaks at 12% on well-optimized DTC brands. In France, AI traffic reaches 0.5 to 2% of total by end of Q1 2026 (lower volumes, AI Mode and AI Overviews not deployed as of May 15, 2026, due to neighboring rights). French-market note: Mistral Le Chat reached 5 million monthly users in 2026 (1M in the first 14 days per Similarweb), with 35 to 40% of mistral.ai traffic coming from France. Add Mistral to your engine tracker list if you sell in FR. Our AI Traffic Report publishes detailed figures by bot and endpoint.
KPI 5 : AI-attributed conversion rate (Tier 3)
Definition: conversion rate of human visits carrying a measurable AI source signal, tracked from landing to checkout.
Method: capture the explicit source signal in first-party storage, then persist it before purchase into a cart or checkout attribute, an order note, or a server-side table keyed to the checkout. The Shopify orders/create webhook reads that order-linked value or table entry. It cannot read the shopper’s browser cookie directly.
Adobe Q2 2026 benchmark (March 2026 data, 1 trillion US retail visits): AI traffic converts 42% better than non-AI traffic on US retailers tracked, with revenue per visit (RPV) +37%, engagement rate +12%, sessions 48% longer, and 13% more pages viewed. The shift is dramatic: in March 2025, the same AI traffic converted 38% WORSE. The gap flipped in 12 months.
On ChatGPT vs Perplexity, directionality depends on sector. Seer Interactive’s single-client case study (Oct 2024 to Apr 2025, 1,370 AI conversions) measured ChatGPT at 15.9%, Perplexity at 10.5%, and Google organic at 1.76% on the same cohort. Treat those figures as directional, not as an e-commerce market average, and measure the rate on your own catalog.
KPI 6 : AI revenue contribution (Tier 3)
Definition: revenue generated by sessions attributed to an AI channel, in absolute value (USD) and as % of total revenue.
Method: aggregation of orders tagged at the previous step, exported to BI (Looker Studio, Power BI, or native Shopify dashboard if sufficient).
Why it is the #1 KPI to defend budget: your CFO does not care about citation rate, they look at how many USD are attributed to the channel. If your AI revenue contribution is 4% on 250K USD/month revenue, that is 10K USD/month directly traceable. If you justify 800 USD/month in GEO investment (audit + content + monitoring), the ROI is 12.5x.
KPI 7 : Crawl health (cross-cutting)
Definition: error rate (non-2xx HTTP status) and average latency on AI bot hits vs human traffic.
Method: server log filtered by AI user-agent, metrics aggregated daily: number of hits, % 200, % 4xx, % 5xx, latency p50 / p95. Cloudflare AI Crawl Control gives these metrics out-of-the-box. Otherwise your observability stack (Datadog, Sentry, Pino logs) with a user-agent filter.
AI bot distribution in April 2026 (Cloudflare Radar AI Insights): Googlebot 30.28%, Meta-ExternalAgent 14.91%, GPTBot 9.84% (declining for 2nd consecutive month), Applebot 9.23% (doubling month over month), Bytespider 5.73%, PerplexityBot 5.12%, ChatGPT-User 4.72%, Google-Extended 4.66%, ClaudeBot 4.42%, OAI-SearchBot 4.32%. The hierarchy shifts fast: the user-agents to monitor must be reviewed quarterly.
Important nuance: per Cloudflare, 80% of AI bot activity is training-driven (vs 20% user-action). The crawl health KPI therefore measures mostly the ability of models to index your catalog for their next training iteration, not immediate click. But without clean crawl, no training, so no citation at 2-6 months.
Why it is critical: a GPTBot crawling your product page for 8 seconds with 50% timeouts signals to OpenAI that your catalog is unreliable. Your KPI 1 (citation rate) will mechanically drop 2 to 4 weeks later. The cause appears nowhere in GA4; it appears only in server logs.
Attribution with and without a referrer
Use three complementary measurement layers. They improve coverage, but they do not turn a visit without a source signal into certain per-session attribution.
Layer 1 : Crawler observability. Server logs classify AI bot requests using maintained user-agent and verified IP evidence. This measures crawl volume, status codes, and latency only. A bot request does not set attribution for a future human visitor.
Layer 2 : Human click attribution. When a visit carries a recognized referrer, UTM, or click ID, the landing page captures it in first-party storage and persists it into a cart or checkout attribute, an order note, or a server-side table keyed to the checkout. This is the layer that can connect a measurable AI-origin click to an order.
Layer 3 : Direct citation tracking. Profound, Peec, Otterly, AthenaHQ query LLMs with your query basket and measure mentions. This measures visibility without clicks. Measurable clicks are covered by Layer 2; the remaining no-referrer cohort must be estimated and reported with an uncertainty range.
Together, the three layers provide a defensible measurement model: crawl health, visibility, measurable clicks, attributable orders, and an explicitly estimated residual cohort.
The minimal dashboard to build this quarter
Three building blocks, ramp-up in 4 to 6 weeks, cost 0 to 200 USD/month depending on citation tool choice.
Block 1 : Crawl health (week 1 to 2). If you are on Cloudflare, activate AI Crawl Control. Otherwise, create a daily log-parser script that aggregates AI bot hits from your Nginx or Cloudflare logs. Output: graph of hits per bot per day, % 200, p50 latency. Free tools: Cloudflare AI Crawl Control, Plausible Logs.
Block 2 : Traffic and conversion (week 2 to 5). Capture measurable human source signals such as referrer, UTM, and click ID. Persist the value into the cart, checkout, order, or a keyed server-side table before purchase, then let the orders/create webhook consume that order-linked value. Output: conversion rate and revenue for measurable AI sources, plus a separately labelled no-referrer estimate.
Block 3 : Citation tracking (week 4 to 8). Choose a tool (Profound Starter at 99 USD/mo billed annually, Peec Starter at 95 USD/mo, or Otterly Lite at 29 USD/mo) or do DIY weekly with a spreadsheet and 30 key queries. Output: citation rate per engine per week, brand context tag per mention, answer coverage per cluster.
The final dashboard fits on a Looker Studio or a Notion page: 7 figures updated weekly, a trend graph per figure, and one line per content wave shipped to measure causal effect.
KPIs to weight differently by vertical
Beauty and skincare: Tier 1 and 4 dominate (strong tendency for AI to recommend skincare brands, more citation without click). Target 30%+ citation rate on Perplexity and 40%+ answer coverage. AI conversion is high (8 to 14%) but volume remains modest.
Supplements and nutrition: Tier 2 and 3 are strategic (strong transactional intent, user looking for a specific product and clicking). Target 5 to 8% AI traffic share with conversion 2 to 3x organic.
Fashion: Tier 1 is hard (LLMs cite few fashion brands by name because queries are stylistic), but Tier 4 is strong. Focus KPIs on AI revenue contribution and answer coverage per stylistic query.
Electronics and tech: Tier 2 and 3 are ultra-strong (Perplexity and ChatGPT excel at tech comparisons). Target 4 to 10% AI traffic share with conversion 4x organic on Perplexity.
Food and beverage: Tiers 1 and 4 dominate, Tier 2 is weak (little direct purchase via AI agent in food in 2026). ROI comes from awareness.
FAQ
Should you start by measuring coverage or traffic?
Start with measurable human traffic signals and crawl health as two separate baselines. If GA4 identifies 0.3% of visits through recognized AI sources, you have a traffic baseline to move. Server logs provide a distinct crawler baseline. Do not merge the two populations.
Will my CFO accept investing on KPIs without long history?
Yes if you present all 7 figures together with a baseline and a 6-month target. The CFO does not validate projects without a target. Example framing: “baseline AI traffic share 0.8% Q1 2026, target 3% Q4 2026, 2x organic conversion, AI revenue contribution target 6% of total revenue, monthly budget 500 USD Verity audit + 99 USD Profound + 8 hours content writer = 1100 USD/month”. Clear 12-month ROI calculation.
How do you know if Profound, Peec, or another citation tool is the right choice?
Compare the exact engines, prompt allowance, geography, export options, and current contractual price for the plan you will buy. At the time of this update, the public entry prices checked were Profound Starter at 99 USD/mo billed annually, Peec Starter at 95 USD/mo with a choice of 3 models, and Otterly Lite at 29 USD/mo. Recheck the vendors before purchase because packaging can change.
Do KPIs change if I sell B2B?
Yes. KPI 5 (conversion rate) is less relevant in B2B because the sales cycle is long. Replace with lead quality score (demo requests or contacts coming from an AI-attributed session). KPI 1 (citation rate) remains central: B2B buyers use ChatGPT and Perplexity to shortlist vendors.
How do you integrate these KPIs into native Shopify reporting?
Shopify Analytics does not track the AI channel by default. Solution: create a Custom Report Shopify with a “Marketing > Source” dimension pre-filled by your middleware. Cleaner alternative: export Shopify orders to BigQuery or Snowflake (official Shopify connector), then Looker Studio on this base with the AI source dimension in visualization.
Are Verity KPIs different from those measured internally?
Verity Score publishes 3 of the 7 KPIs publicly: citation rate (via the Share of AI Voice audit module), answer coverage (via the Answer Coverage dimension), and crawl health (via AI Traffic Report). The other 4 are measured in your own stack and are not in the scope of an external audit.
Bottom line
GEO ROI is measured with 7 KPIs structured on 4 tiers: citation rate, brand context, answer coverage upstream; measurable AI traffic, attributable conversion and revenue downstream; crawl health cross-cutting. Three layers cover crawler observability, human click attribution, and citation tracking. Traffic without a usable source signal remains an estimate, not certain per-session attribution.
The trap to avoid: only measuring one tier. A Share of AI Voice at 25% without conversion tracking leads you to invest in content that does not monetize. An AI traffic share at 3% without citation tracking makes you miss half of the AI brand-building effect.
To start, pull your own baseline: crawl health from your server logs, citation rate on a 20-query basket, answer coverage per cluster. To dig into the traffic and conversion layer, read Why GA4 is lying about your AI traffic and Share of AI Voice: 2026 guide.